Displaying collected data clearly in a system is important. The KRIS trend system module makes it easier for you to graphically display measured, calculated and binary values.
KRIS Trend System
Interpreting Data with KRIS
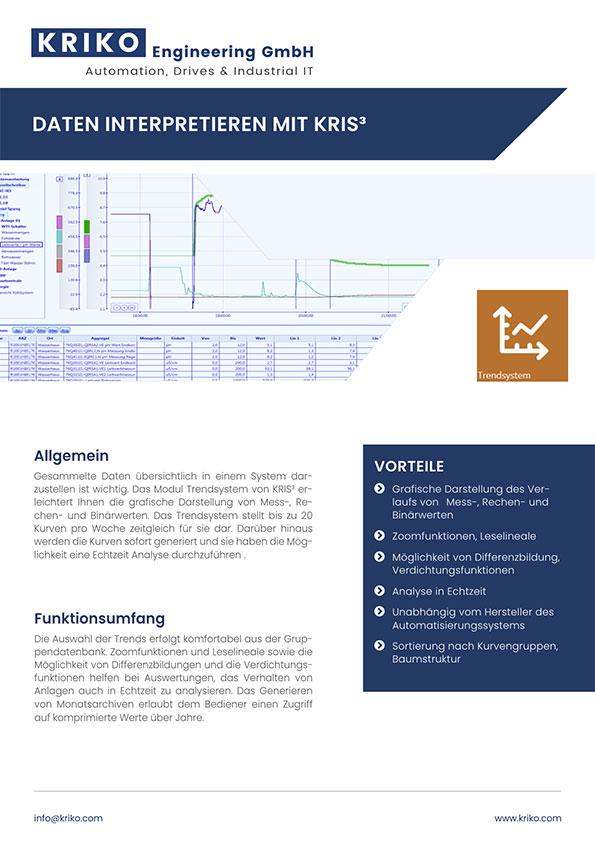
Displaying collected data clearly in a system is important. The KRIS trend system module makes it easier for you to graphically display measured, calculated and binary values. It displays up to 20 curves per week simultaneously for you. In addition, the curves are generated immediately and you have the option of carrying out a real-time analysis.
Advantages:
Graphical display of the progression of measured, calculated and binary values
Zoom functions, reading rulers
Possibility of difference formation, summarization functions
Real-time analysis
Independent of the manufacturer of the automation system